
How Screwed Am I? Week 6 Edition
Analyzing 150,000+ teams from last season to see how cooked your team might be this season

Mike
2 time league playoff participant
It is time for our weekly writeup where we run the numbers on how screwed your team is based on your performance thus far. This may be a fool's errand -- after all, being "screwed" is primarily a state of mind that is not based on numbers and data, but vibes. Just yesterday, I was talking with a friend in my main league who claimed that despite being 5-1 and the number 1 ranked team in the league, he was "not a contender". Your individual circumstances can always vary, yes...but let's dive into how things have historically panned out.
The first two installments were focused primarily on your team's record. This week, we're getting a little nerdier. A common complaint at this point involves matchup luck:
"I am 2-4 but I play the best team every week! I'm so unlucky!"
In many cases, this point is a valid one. In a small sample size of six, matchup luck can have a large bearing on your team's record. That's why today we decided to take a look at power record, also known as "all-play" (throughout this article I will use "power record" and "power win %" to refer to this concept).
Explanation for those unfamiliar with all-play:
In all play, we match up every team with every other team in the league each week. For example, in a 10-team league, each team would play 9 hypothetical 'games' against every other team in the league. If your team scored the 3rd highest points in the league, your 'All-Play Record' for that week would be 7-2, regardless of your actual matchup's outcome. Power rankings are calculated by determining which teams have the highest winning percentages for those hypothetical matchups.
This effectively eliminates matchup luck from determining how good a team is. Scored 2nd highest but lost your matchup? No problem, you went 8-1 in a 10-team league. It's also a better indicator than pure points for/points against. Unfortunately, I have personal experience with this. This season, when my team loses, they lose big. I am 3-3 but I have lost two matchups by a combined 200 points. I have the highest points allowed in my league but in my case, I haven't had any truly bad luck because my team was horrible in those two weeks. I wouldn't have beaten anyone else, either.
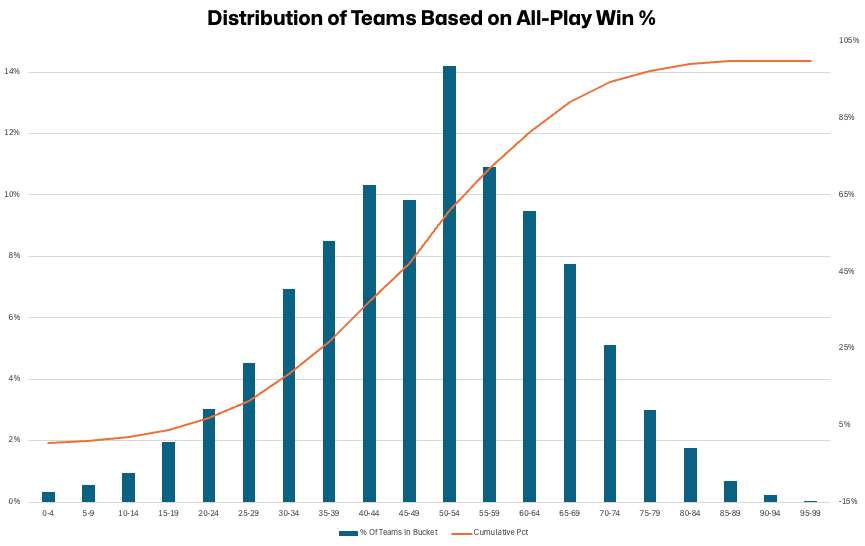
First, let's look at what a "good" power record is. Teams heavily cluster around the 40-60% mark. Most of you are mid. The distribution here is important because you might think that a power win percentage of 25% means that you're probably in the 25th percentile of teams. But a power win percentage of 25% is terrible. That puts you at a percentile of closer to 7% due to the distribution laid out below.
Okay with all that boring stuff out of the way...let's figure out how cooked you are.
Where you draw the line of being screwed is a personal decision. Some are like my friend who, sitting at a 90% chance of making the playoffs, thinks that he is screwed. Others are like Han Solo and don't want any C-3PO nerds (me) telling them the odds.
Now I know what you're thinking -- it sounds like a pain in the butt to calculate my all-play record. Fear not! You can sync your league right here on Fantasy Genius and get all-play records for your league in just one minute! We pull in your head to head record, all-play record, and record vs. median.
This is an extra special week for us here -- we had guest writer Rodger Sherman write up your league's week 6 recap!
You can get those things, plus everything else in your league's data hub, for free until Monday October 20th.
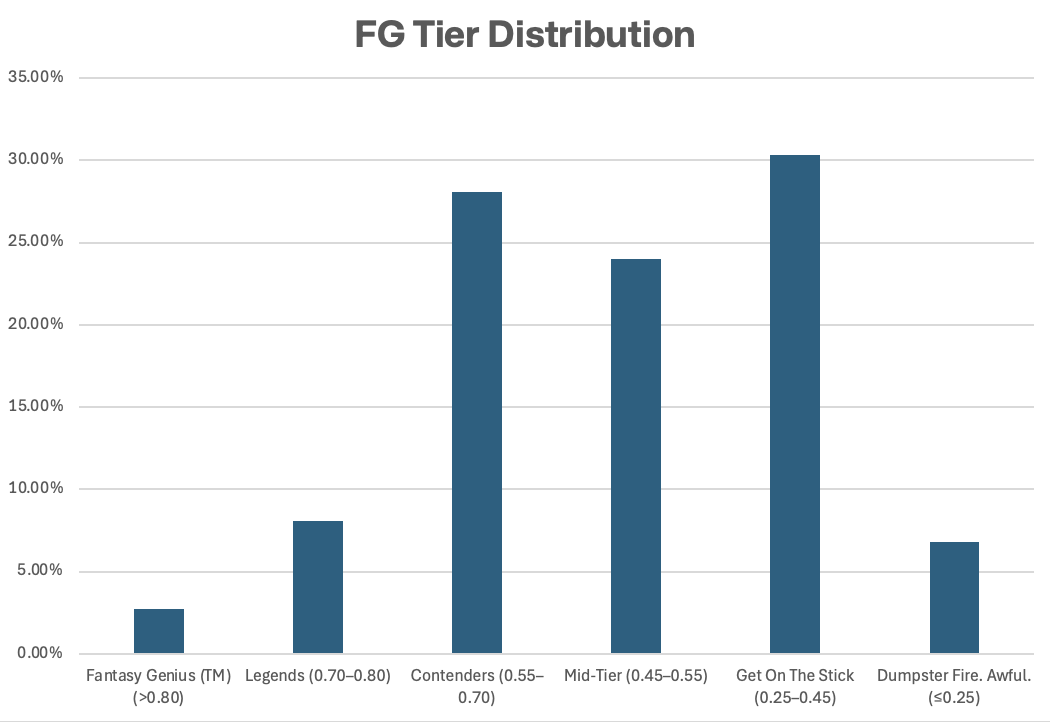
We pull each team into a tier so that you don't have to look at scatter plots like a nerd every time you look at your league homepage. It takes a crazy level of dominance to reach the "Fantasy Genius" tier -- I currently only have one person in all of my leagues that is in this tier. She's a new mother which famously is not a lot of work so I'm sure she's spending her loads of free time creating fancy statistical models to help inform her fantasy decisions. Kind of unfair if you think about it.
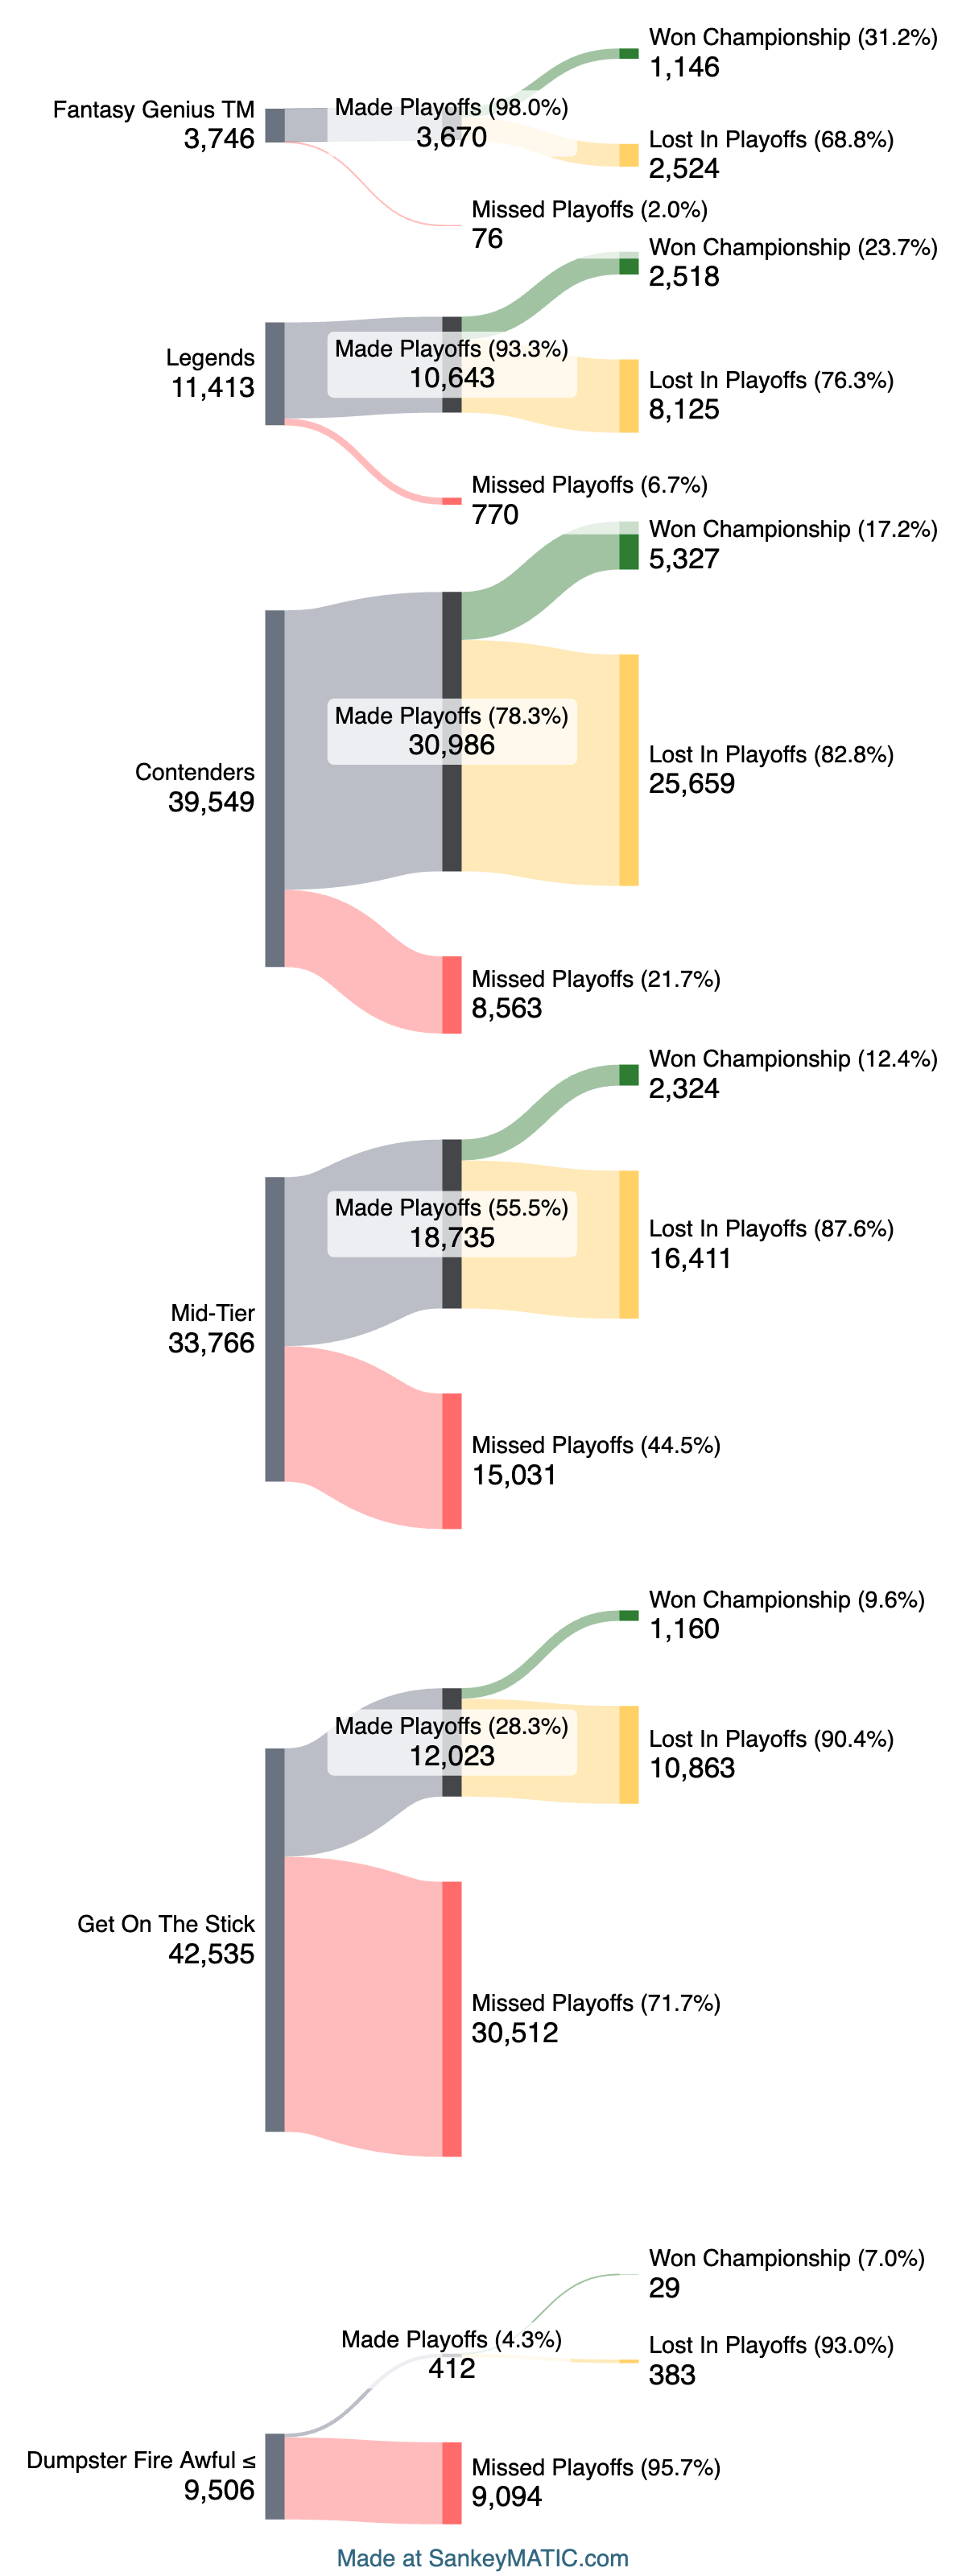
Here is a preposterously large Sankey that shows the playoff and championship rates of each tier:
Here are the 2024 playoff rates for regular ol' head-to-head records through six weeks:
Record | Playoff Rate |
|---|---|
0-6 | 2.0% |
1-5 | 10.0% |
2-4 | 29.6% |
3-3 | 55.9% |
4-2 | 80.0% |
5-1 | 93.5% |
6-0 | 98.6% |
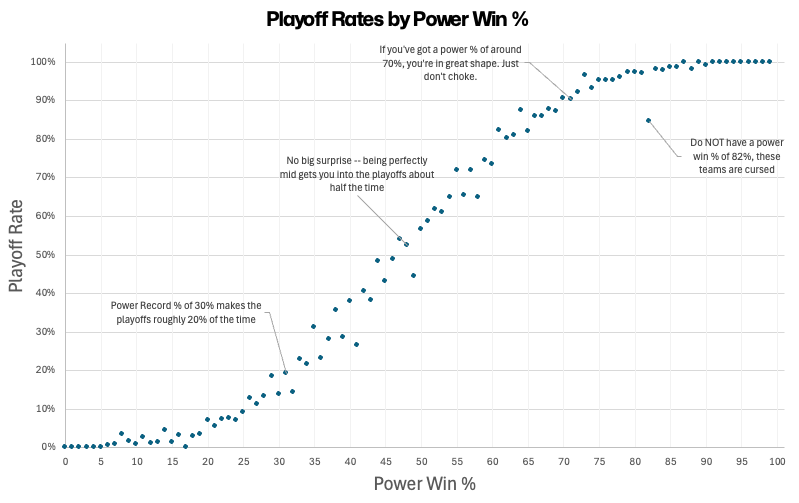
Using my team as an example, my 3-3 team according to simple head-to-head record is sitting at 55% playoff rate. But my team actually kinda sucks -- my power % is closer to 40% (I've squeaked out some wins and gotten wrecked twice). Teams like mine have historically made the playoffs just 30% of the time. But 30% isn't dead...when I was a kid terrified of thunderstorms, I would log on to weather.com every morning and check the chance we were going to get hit. And if it said 30% chance of isolated storms, I started shaking in my boots. That means I need to be equally excited about the possibility of a playoff run as I was scared to death of lightning and wind.
My weekly disclaimer: Like most things in life, your specific circumstances may make your odds better or worse than what is presented above. (watch as I expertly neg my own team here). If you're 3-3 but have Omarion Hampton, Bucky Irving, and Garrett Wilson all injured, your odds may be worse.

Each week, I look up which players are most represented on teams at each record.
Record | Player |
|---|---|
6-0 | Jonathan Taylor |
6-0 | Bijan Robinson |
6-0 | Jahmyr Gibbs |
5-1 | Drake London |
5-1 | Jake Ferguson |
5-1 | Jonathan Taylor |
4-2 | Jonathan Taylor |
4-2 | Jake Ferguson |
4-2 | Emeka Egbuka |
3-3 | Derrick Henry |
3-3 | Courtland Sutton |
3-3 | David Montgomery |
2-4 | Marvin Harrison |
2-4 | Tony Pollard |
2-4 | Ashton Jeanty |
1-5 | Bo Nix |
1-5 | Tee Higgins |
1-5 | Ashton Jeanty |
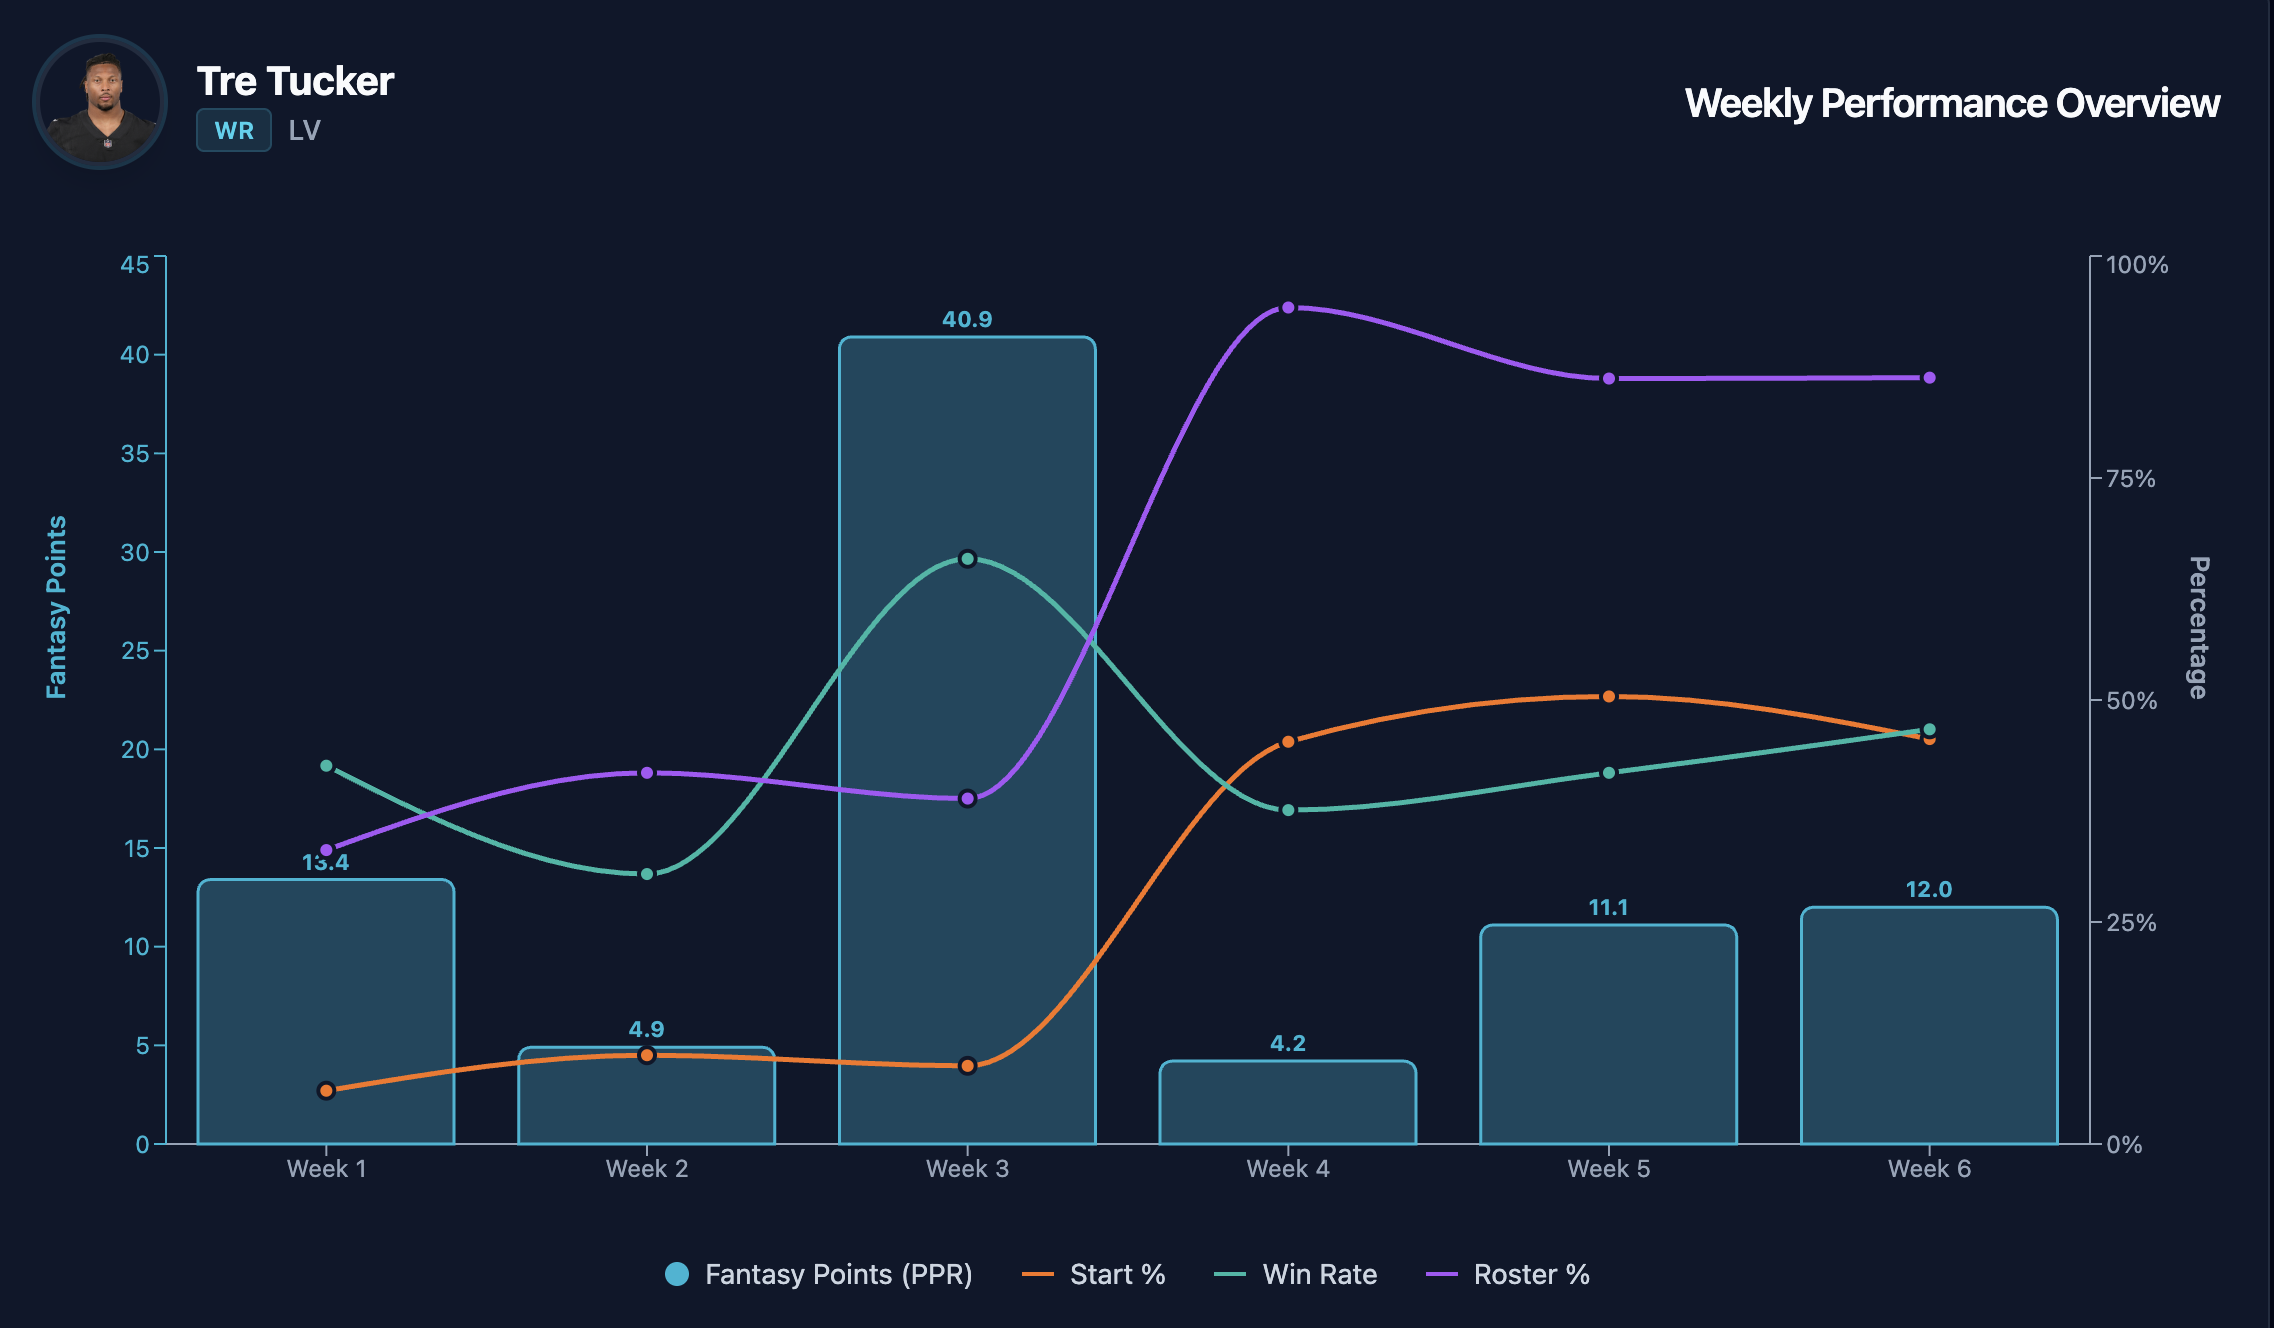
0-6 | Tre Tucker |
0-6 | Matthew Golden |
0-6 | TreVeyon Henderson |
Wait...Tre Tucker? Didn't he have a monster 40-point game? Why is he the most common player on 0-6 teams? Aha! It's because these teams didn't start him when he actually had his monster game. They picked him up after his huge week 3 performance and spent the next three weeks chasing that high which has never returned. My absolute favorite thing to look at in these charts.
Thanks for reading! If you enjoyed this, don't forget to subscribe to get this weekly series delivered straight to your inbox.
-Mike


